
1
Methodology
The main objective of the EDU20C Project is to model educational development in the 20th century by reconstructing the educational composition of the population by age (5-year age groups) and sex all over the world from 1900 to 2010 in 5-year steps. In a first stage, the project focuses on 30 countries in the Americas, Europe, Asia and Oceania. The comprehensive, consistent and comparable time series that will ensue will allow us to sketch the global patterns and paces of the education transition.
The methodology relies on an adapted version of the multidimensional cohort component model developed by Andrei Rogers in the 1980s. The model reconstructs past levels of educational attainment relying on the principle that education is primarily acquired at young ages and therefore constitutes a fixed attribute later in life that cannot be reversed nor increased. The large majority of further training during adult life aims at acquiring skills and more rarely at advancing to the next level of education. Hence, the educational attainment composition of a population encompasses the educational development of the past, which can be reconstructed along cohorts. If we know the proportion of 50-year olds with post-secondary education in 2010, their share is a valid estimate of the proportion of 40-year olds in 2000. Only two elements can upset the equation: differential mortality and migration by education.
We estimate the mortality differentials by education using country-specific life tables for the period 2015 to 1950 from the United Nations (2015), to which we applied mortality differentials by education. Mortality differentials are expressed in terms of life expectancy at age 15 (e15). Education differentials in mortality are not commonly available. They have been estimated for only a few countries, mostly in more advanced countries. Therefore, it was decided to use standard differential schedules based on the literature and previous exercises (Lutz et al. 2014). We assumed a difference in e15 of 6 years for men and 4 years for women between the lowest and the highest education category. Furthermore we assumed the education differentials in e15 for men to have a 1-1-2-1-1 year pattern between the no education, some primary, completed primary, lower, upper, and post-secondary education levels, respectively—and the same proportionally for women (Lutz et al. 2007, Lutz et al. 2014, Goujon et al. 2016).
The initial mortality differentials by education are converted into education-specific mortality rates that converge along a logarithmic trend extrapolation to no differentials in life expectancy at age 15 (e15) by 1950. This assumption is based upon the fact that we do not have any empirical information about mortality differentials by education for the past. Additionally we are using historical data points in the education extension, which should implicitly include those differentials. Furthermore, chronic conditions, which are more prevalent nowadays, are more stratified by education, compared to infectious diseases as were common in the 1950s and before. The reconstruction model takes care iteratively of education differentials in mortality: mortality differentials are applied at each back-projection step to the population by age, sex and education. For a country with a base-year in 2015 this would mean 13 iterations to reconstruct in 5-year-steps to 1950. The number of iterations can differ depending on the initial base-year.
Furthermore, at younger ages (15–34), when a population may still be moving to higher levels of education, it is necessary to estimate the transition patterns. We used education attainment progression ratios (EAPR) that are calculated based on the initial base-year education structure. We fit a trend line to EAPR (in logarithm) to project past EAPRs. These are then applied to the reconstructed population by age, sex and education, after applying mortality.
We fill the historical information in the initial education distribution, extending artificially the age structure to higher ages (160+). For instance, if we know that in country i 36% of the 65–69 male population had lower secondary education in 1965, and if the base-year is 2010, this will be converted into the share of the 110–115 years old in 2010. This information concerns the education distribution (shares) and not population stock (absolute) since we know that none of them is still alive. This information is particularly useful for filling the information about the last open-ended age group (100+). As mentioned before, at each reconstruction step the age, sex and education distribution is shifted to 5 years earlier (e.g. the population of women aged 30 to 34 years in 1995 becomes 25–29 in 1990). As a result, the highest open-ended age group of 100+ becomes empty as this cohort shifts to 95 to 99 years. The vacant open-ended age group is then filled with the education distribution extension assessed earlier. Once the education distribution by age and sex has been finalised, it is then applied to the United Nations population estimates (United Nations 2015) for the period 2010 to 1950. For the period before 1950, we use historical census information on population by age and sex to estimate consistent and comprehensive time series.
The following illustration shows the schematic process operation by 4 working packages (WP 1: Data Collection and Harmonization, WP 2: Reconstruction Model, WP 3: Validation and Revision, WP 4: Dissemination) within the overall reconstruction and the related tasks:

As mentioned above, the other disturbance that can affect the back-projections is education differentials in international migration. This is taken care of in the validation phase where the reconstructed data are confronted with historical data. In case of discrepancy, the data are adjusted to reflect the changes in the composition.
This reconstruction is based on population data by 5-year age groups, sex and highest educational attainment in the base-year that has been compiled and harmonised for 185 countries in the world. In total, we were able to collect more than 1,200 recent and historical data points for all 185 and about 235 data points for the 30 initial EDU20C countries on educational attainment and literacy that had to be processed and harmonised for usage in the reconstruction model. For the harmonised education categories we distinguish between 6 categories (1950 to base-year) and 4 categories (1900 to 1950).
Education Categories
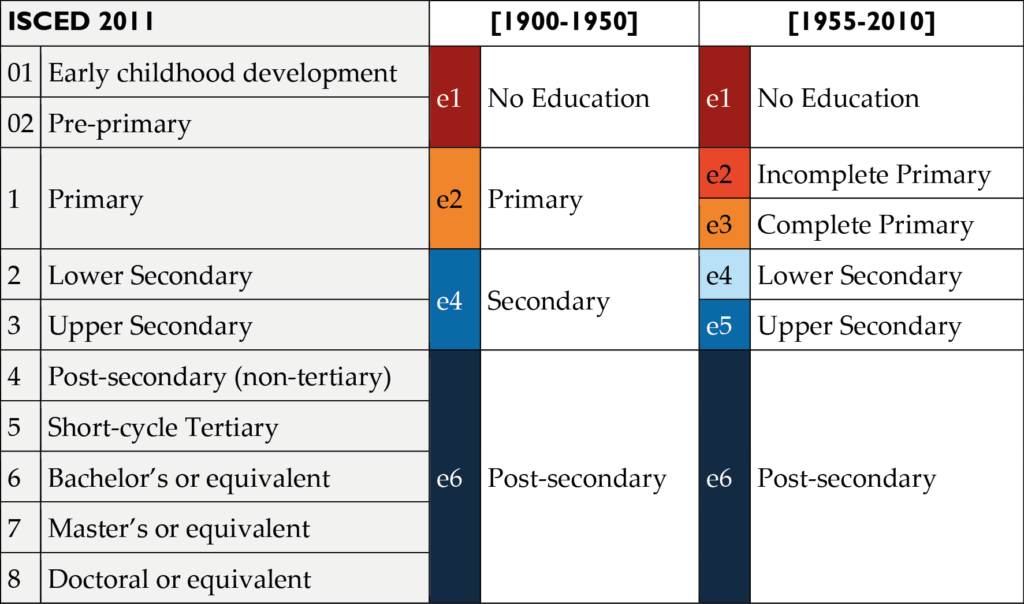
From 1950 to 2010, the population is disaggregated into 6 education categories
- No education
- Incomplete primary education
- Primary education (ISCED 1)
- Lower secondary education (ISCED 2)
- Upper secondary education (ISCED 3)
- Post-secondary education (ISCED 456)
From 1900 to 1950, the number of categories was reduced to 4 because of the difficulty to find existing data to validate the reconstruction.
- No education
- Primary education (including incomplete)
- Secondary education (lower and upper)
- Post-secondary education
The following table shows the used educational categories at a glance for the reconstruction period from 1900 to 2010 in comparison with the ISCED 2011 classification:
Mean Years of Schooling
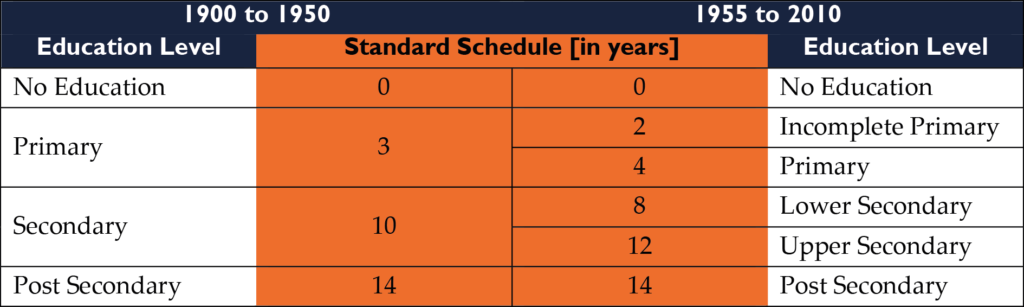
The indicator of mean years of schooling (MYS) is frequently used for comparison across countries and time as it has the advantage of expressing the quantity of educational attainment present in a population in a single number. To compute MYS one needs information on shares of persons with a given educational attainment level and duration of schooling for these levels. As straightforward as the computation of MYS may seem, it is at the same time complex for three main reasons. First, standard duration of schooling varies across countries and time. Second, the calculation is biased by the presence of pupils/students who do not complete the full course at any level, which amounts to substantial shares in some countries. Third, there is a broad spectrum of courses at post-secondary level ranging from short 1–2 year certificate trainings to full post-secondary education completed by bachelor or master degrees (or their equivalents) which creates the necessity to make an assumption on the average number years of schooling to attribute to this education category (Goujon et al. 2016, Potančoková et al. 2014).
For the calculation of MYS in EDU20C we use a standard schedule (regardless of each country’s education system) to increase comparability between countries, based on empirical education schedules. For the period 1900 to 1950 we average the corresponding education categories from the period 1955 to 2010:
Universal Lower Secondary Education
We link progress in education by using universal lower secondary education as educational benchmark for countries and regions. Universal lower secondary education, which is more and more considered as the compulsory level of education, is attained when 90% or more of the population in the age group 30 to 34 years have at least lower secondary education—taking into consideration that 100% is rarely achieved due to migration of less educated population (see also Goujon et al. 2016, European Commission 2010, Roth and Thum 2010).


EDU20C is a project of the Human Capital Data Lab at the Wittgenstein Centre (IIASA, VID/ÖAW, WU), Vienna Institute of Demography (Austrian Academy of Sciences) and is funded by the Anniversary Fund of the City of Vienna for the Austrian Academy of Sciences.